
We already know that Compound Annual Growth Rate (CAGR) is one of the best metrics for measuring investment performance. However, percentage figures can often feel abstract—what is the practical difference between a 4.27% and a 7% annual return?
While abstract percentages can be hard to visualize, we can express this gap using time. Converting returns into “how many years it takes for your capital to double” makes the comparison immediate and actionable.
There is an extremely intuitive measurement tool for this: the Rule of 72.
Table of Contents
1. What is the Rule of 72? Calculate Doubling Time in 5 Seconds
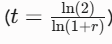
The Rule of 72 is exceptionally simple—no Excel required, just mental math:

Consider Two Concrete Examples:
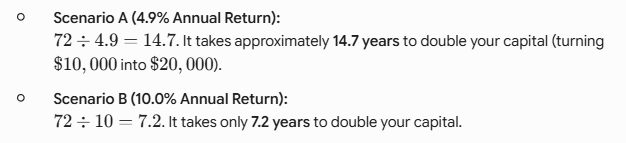
For the exact same amount of money, one takes 15 years while the other takes only 7—that is how concrete the difference becomes.
2. Is the Rule of 72 Accurate? A “Good Enough” Decision Framework
Some might wonder: The Rule of 72 is just an estimate, but how accurate is it really? Let’s compare the Rule of 72 estimates against exact mathematical compounding:
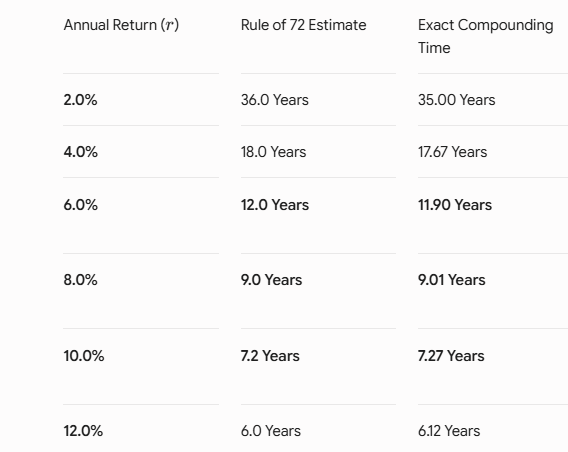
Are there differences? Yes, but they are minimal—especially in the common 6% to 10% range, where the error is under 0.1 years.
If you are conducting a scientific experiment, precision is paramount. However, the goal of the Rule of 72 is not exact accounting, but giving you a mental framework in five seconds to decide whether an investment deserves deeper research. This margin of error does not affect high-level decision-making.
3. Interactive Calculator: When Will Your Assets Double?
Now it’s your turn to calculate: What is the average annual return on your main investments or savings? Plug it into the Rule of 72—how many years will it take for your money to double?
Use the multi-scenario Rule of 72 Calculator below to toggle between different asset types or reverse-calculate the required return rate for your target timeline:
Rule of 72 Calculator
=RRI(3,100,116)=RRI(5,800,960)=RRI(6,30,31.6)=RATE(10,-18000,-290000,714200,0)=LOG(2)/LOG(1+6%)4. Diminishing Marginal Utility & The "Financial Sweet Spot"
If you plot different annual return rates against their corresponding doubling times on a curve, you will notice a fascinating pattern:
Starting at a 6% annual return, the curve flattens out noticeably.
What does this tell us? The time saved by pushing for higher returns decreases progressively:
- 1% --> 6%: Increasing returns by 5% slashes doubling time from 72 years down to 12 years (saving a massive 60 years!).
- 6% --> 12%: Increasing returns by another 6% reduces doubling time from 12 years down to 6 years (saving 6 years).
- 12% --> 18%: Increasing returns by another 6% cuts doubling time from 6 years down to 4 years (saving only 2 years).
More importantly, as expected returns increase, the risk you must take and the energy you must expend grow exponentially—there is no free lunch in finance.
Chasing returns of 12% or higher requires immense effort, is difficult to find consistently, and yields diminishing marginal gains. Working tirelessly for diminishing returns leads to physical and mental burnout.
Historical data shows that broad market ETFs like VOO (S&P 500), quality REITs, or dividend growth staples like Coca-Cola (KO) have historically delivered compound annual returns between 7% and 12%. This range balances risk and reward—representing the Financial Sweet Spot.
5. A Quantitative Perspective: Seeking Repeatable Rationality
Where does your current portfolio sit on this curve?
The ultimate goal of investing is not to chase hype or ungrounded windfalls. In quantitative analysis and stock selection, the core philosophy remains:
- Avoid Low-Return Risk Traps: Do not remain stranded in 1%–3% assets that get eroded by inflation.
- Target the 7%–12% Sweet Spot: Utilize dividend quality analysis, mean reversion, and historical backtests to build durable capital and cash flow growth under acceptable risk.
- Reject Extreme Marginal Risks: Avoid spending most of your energy gambling on black-box schemes promising 20%+ returns accompanied by total capital loss risks.
Master the Rule of 72 and spend 5 seconds auditing your portfolio today. Finding a sweet spot where returns are reasonable and risks are acceptable will keep your compounding journey smooth and steady.
Part 1:How to Calculate Dividend Yield? Don't Get Fooled by High Yields!
Part 2:Dividend Yield vs. Bank Deposit: What’s the Real Difference?
Part 4:What Is TTM Dividend Yield? The Historical Data Trap Most Dividend Investors Fall Into
Part 6:What is the Dividend Yield Percentile? A Must-Know Valuation Metric for Dividend Investors
Part 8:What Is Annualized Return? Plus Free Annualized Return Calculator
Part 9:Savings vs. Investing: Don’t Let “Paper Safety” Steal Your Future