
Here’s a story. Mike owns a stock with a 7% dividend yield. He’s held it for three years.
A friend asks how much he’s made. Mike doesn’t even reach for a calculator: “7% for three years, that’s gotta be 21%, right?”
Is Mike right? My guess is most people already sense something’s off, but can’t quite say where. Let’s take his math apart, step by step, and along the way, get clear on the metric that actually answers this question: annualized return.
Table of Contents
Step One: Don’t Multiply Yet — Work Out the Total Return First
A 7% dividend yield means the stock paid out 7% of its price in dividends in a given year. That’s it. It doesn’t mean you made a 7% return, and it definitely doesn’t mean you can just multiply it by the number of years you’ve held the stock.
If this were a bank CD, dividend yield and return would basically be the same thing, because the principal in a CD never changes — whatever interest you’re paid, that’s your return, full stop. Stocks don’t work that way. The share price itself moves. Your principal isn’t fixed. Dividend yield only captures half the picture — the payout half. It says nothing about the other half: what happened to the price.
So to find out what Mike actually made, we need to go back to basics: How much did he pay? What’s it worth now? How much cash did he collect along the way?
Let’s say Mike’s numbers look like this: bought at $100, now worth $95, and he collected $21 in dividends over three years.
Total return = (Current value + Cumulative dividends − Cost basis) ÷ Cost basis = ($95 + $21 − $100) ÷ $100 = 16%
That’s not bad on the surface — a 16% total return. But is that really the full story? Do you actually know what that 16% is telling you?
Step Two: 16% Is a Three-Year Tally, Not a Yearly Report Card
Total return has no concept of time. But our lives are finite, and investing only means something if it produces results within that finite window — which means return has to be translated into a per-year figure before it’s useful for comparison or planning.
At this point, Mike might think: “Fine — 16% divided by 3 years, that’s about 5.3% a year.”
That’s a reasonable instinct, but it still misses something important: money compounds. Formally, we call this compound interest. Year one’s return becomes part of year two’s base; year two’s gain stacks on top of year three. Dividing by the number of years treats each year’s return as isolated and unrelated to the others — but in reality, the longer the time horizon, the more compounding effects show up.
The real question Mike should be asking is: over these three years, averaged out per year on a compounding basis, did he actually gain or lose — and by how much? The number that answers that question is annualized return.
Annualized Return: Turning the “Total Tally” Into a Real Per-Year Score
Annualized return — also called CAGR, Compound Annual Growth Rate — is calculated like this:
Annualized Return = [(Ending Value + Cash Received) ÷ Starting Cost] ^ (1 ÷ Years Held) − 1
Plugging in Mike’s numbers:
($95 + $21) ÷ $100 = 1.16
1.16 raised to the power of 1/3 ≈ 1.0507 Annualized return ≈ 5.07%
Compared to the simple division of “16% ÷ 3 = 5.33%,” that’s only a 0.26 percentage point difference — doesn’t look like much. But don’t underestimate that 0.26%. Stretch the same math over 10 or 20 years, and the gap between simple division and true compound annualized return widens dramatically. That’s exactly why retirement projections, insurance policies, and real estate — anything involving a long holding period — always talk in terms of “annualized,” never “total return divided by years.”
The Formula Looks Simple. Doing It by Hand Isn’t. Let the Computer Handle It.
Exponents and roots are next to impossible to do in your head, and even punching them into a regular calculator invites typos. Good news: none of this needs to be done by hand.
In Excel, one function does the whole job:
=RRI(years, starting amount, ending amount + cash received)
Plug in Mike’s numbers: =RRI(3, 100, 116) and Excel spits out 5.07% instantly — a lot faster than flipping through exponent tables.
You can also ask an AI, but it costs you communication overhead. You’d need to spell out “bought at what price, worth what now, held for how long, collected how much cash” in one go — miss a single detail and the answer comes out wrong. Excel, or the ready-made calculator later in this post, just needs the numbers plugged in; no back-and-forth needed to confirm the conditions, which makes it a lot faster.
Level Up: Your Advisor Says “14.6% Annualized.” Should You Believe It?
Now that we know what annualized return actually is, every investment product can, in theory, be converted to the same standard for comparison. That’s exactly why this metric matters so much — it’s a universal ruler.
Let’s raise the difficulty a notch. Say a financial advisor pitches you a deal: “We’ve got a program right now — put down $290,000 and you can own a $1,000,000 asset; the bank finances the remaining $710,000. You only pay $1,500 a month in interest, and after 10 years, once the loan is paid off, you walk away with $714,200. Net of the interest you paid over those ten years, that averages out to about 14.6% a year.”
Mike’s gut tells him something’s off. Annualized return, he remembers, comes from “starting value,” “ending value,” and “years held.” Now there’s a loan and a monthly interest payment thrown into the mix — a bunch of new terms. How do those numbers even go into the formula?
Don’t panic. Loans and interest payments sound intimidating, but they’re just packaging. All you need are four key numbers:
- Initial investment: $290,000
- Annual outlay: $1,500 × 12 months = $18,000 (paid at the start of each year)
- Investment period: 10 years
- Final payout: $714,200
This “pay a fixed amount every year, get one lump sum back at the end” structure has its own dedicated Excel function — RATE(). Just remember: money going out gets entered as a negative number.
=RATE(10, -18000, -290000, 714200, 1)
The answer: an annualized return of 5.07% — not the 14.6% the advisor quoted. Sound familiar? It’s the exact same number Mike got from holding his stock for three years. No matter how complicated the packaging gets, break it down far enough and it’s always the same underlying logic: lay out every cash flow, convert it into a true per-year return, and only then do you know what you actually made.
The Recap: Three Sentences Worth Remembering
Dividend yield is not total return. Total return is not annualized return. Investing only means something with a time frame attached — and annualized return is the one number you can actually use to compare across completely different deals.
To calculate annualized return, you really only need to pin down a handful of variables: how much you put in up front (starting amount), whether there’s a recurring contribution or payout along the way (annual cash flow), how long you held it (years), and how much you end up with (return). Know any four of these, and you can solve for the fifth.
The All-in-One Annualized Return Calculator: Know 4 of 5 Numbers, Solve for the Last One
Starting amount, annual contribution (enter 0 if not applicable), investment period, final return, and annualized return — five variables. Know any four, and the calculator solves for the missing one.
This isn’t a gimmick. Here’s why it matters: say you have $10,000 saved right now, and you can put away $500 a month ($6,000 a year). You’ve found a product with a historical annualized return of around 10%, and your goal is to retire with $1,000,000. How many years will it take? Plug those four numbers into the “General” tab, select “Solve for: Investment Period,” and the answer comes back — roughly 28.5 years.
If you’re 35 now, that gets you to retirement right around 65. But if you’re already 45, this particular plan probably isn’t going to get there in your lifetime. At that point, you’ve really got three options: save more each month, lower your retirement target, or — chase a higher-return product, which usually means taking on more risk. That’s a separate, and much more careful, trade-off.
Below is an annualized return calculator that covers stocks, real estate, and life insurance policies—the three most common annualized-return scenarios—plus this general-purpose 5-variable calculator, all in one place. Switch tabs to match whatever you’re actually holding:
=RRI(3,100,116)=RRI(5,800,960)=RRI(6,30,31.6)=RATE(10,-18000,-290000,714200,0)=LOG(2)/LOG(1+6%)One Question Still Unanswered
Mike now knows he actually made 5.07%, not the 21% he first guessed. But there’s still a question left hanging: dividend yield can’t tell you what your future annualized return will be — even if you could guess next year’s dividend, you still have no idea where the stock price is headed.
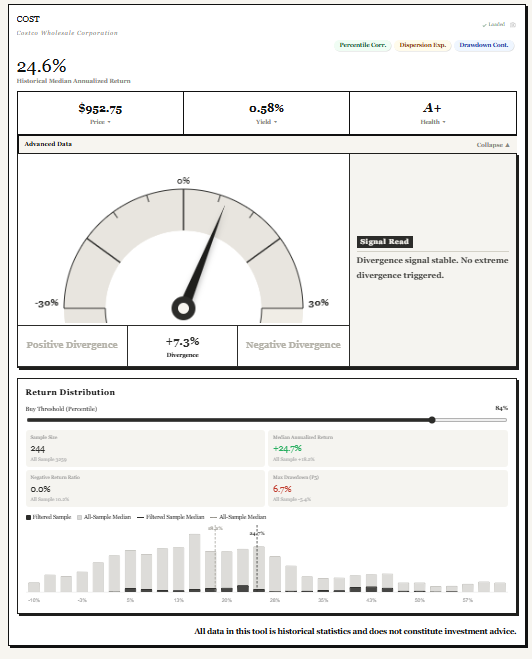
Annualized return only tells you what already happened. It can’t predict the future. What you can do is compare today’s dividend yield against that same stock’s own historical range — which is exactly what Yieldspot does: it turns 14 years of a stock’s historical dividend yield into percentiles, and cross-references that against the historical median annualized return, so you’re not just staring at a bare “7% yield” — you can see where that 7% actually falls in the stock’s own history, and what range of annualized returns it has historically led to.
Annualized return is a genuinely important number for investing — but knowing the number isn’t the same as knowing what it means. Is 5.07% good or bad? Without a benchmark, there’s no way to make a well-informed call. That’s a question for next time.
FAQ
Q1: Do Excel’s RRI and RATE functions give the same result as working out the exponent formula by hand? Yes. Both functions are solving the exact same time-value-of-money equation under the hood — they just package the exponents, roots, or iterative solving into a single function so you don’t have to do it manually.
Q2: My dividends (or rent, or policy payouts) came in multiple installments — is this still accurate? The simplified version (RRI) assumes all cash received is collected in one lump sum at the end — it’s a simplified estimate. If the timing of each cash flow varies significantly (say, monthly dividends or payments), using RATE or NPER — functions that account for periodic cash flows, which is what the “General” calculator above uses — will get you a more accurate answer.
Q3: How big is the gap between simple average return (total return ÷ years) and true annualized return, typically? The shorter the holding period, the smaller the gap. The longer you hold, the more compounding gets smeared out by simple division, and the wider that gap grows. That’s exactly why annualized return — not total return divided by years — is the number to use for anything you’re holding long-term.
Q4: Does a rising dividend yield mean it’s a good time to buy? Not necessarily. A rising yield can mean one of two things: the price got unfairly beaten down and is now cheap, or the company’s fundamentals are deteriorating and the price hasn’t finished falling yet. Yield alone can’t tell you which — you need historical percentile data and fundamentals to make that call.
This article is shared for educational purposes only and does not constitute investment, insurance, or real estate advice. Please evaluate your own risk tolerance or consult a licensed professional before making any financial decisions.
Part 1:How to Calculate Dividend Yield? Don’t Get Fooled by High Yields!
Part 2:Dividend Yield vs. Bank Deposit: What’s the Real Difference?
Part 4:What Is TTM Dividend Yield? The Historical Data Trap Most Dividend Investors Fall Into
Part 6:What is the Dividend Yield Percentile? A Must-Know Valuation Metric for Dividend Investors
Part 8:What Is Annualized Return? Plus Free Annualized Return Calculator
Part 9:Savings vs. Investing: Don’t Let “Paper Safety” Steal Your Future