Understanding the Risk-Free Rate is the foundation of every successful long-term investment strategy. In our previous beginner tutorials, we spent significant time breaking down Compound Annual Growth Rate (CAGR), compound growth, and the Rule of 72. We identified our 7% to 12% “Sweet Spot” and equipped ourselves with clear quantitative logic and calculation tools.
Many investors reach this stage and experience a wave of confidence: “The logic is clear, I have the tools. Now, isn’t it just a matter of finding an asset with reasonable returns and letting time do the work?”
Real life, however, does not work like a spreadsheet.
I firmly believe that countless investors lose money in the market not because they lack technical knowledge, nor because their calculators were wrong, but because they ignore the fragility of human psychology and the emotional reality of risk versus reward.
Table of Contents
The 2020 Script: Everyone Knew the Theory, So Why Did They Sell at the Bottom?
Cast your mind back to March 2020, during the initial global outbreak of COVID-19. In just 33 short days, the US stock market plummeted by 34%, triggering multiple historic circuit breakers.
During those chaotic weeks, countless investors panicked and did the exact same thing: they sold every stock they owned.
Did these companies’ core fundamentals collapse overnight? No.
Did their original investment logic become invalid overnight? No.
For the most part, people sold simply because they couldn’t handle the psychological pressure anymore.
News headlines screamed about “unprecedented economic collapse” every single day, while paper portfolio values evaporated by tens or hundreds of thousands of dollars. The words “just wait it out” look rational inside an Excel file, but in the face of a real market crash, saying them is vastly different from executing them.
You know how the story played out: over the following months, the market staged a historic rally and roared back to record highs. Meanwhile, many of those who panicked and liquidated at the bottom never bought back in.
This is not an isolated tragedy; it is the recurring script of every major market crash.
To break this cycle, we cannot remain mesmerized by compounding formulas in an idealized vacuum. We must return to the true starting point of investing: the Risk-Free Rate and the Equity Risk Premium.
The Foundation of All Investments: What is the “Risk-Free Rate”?
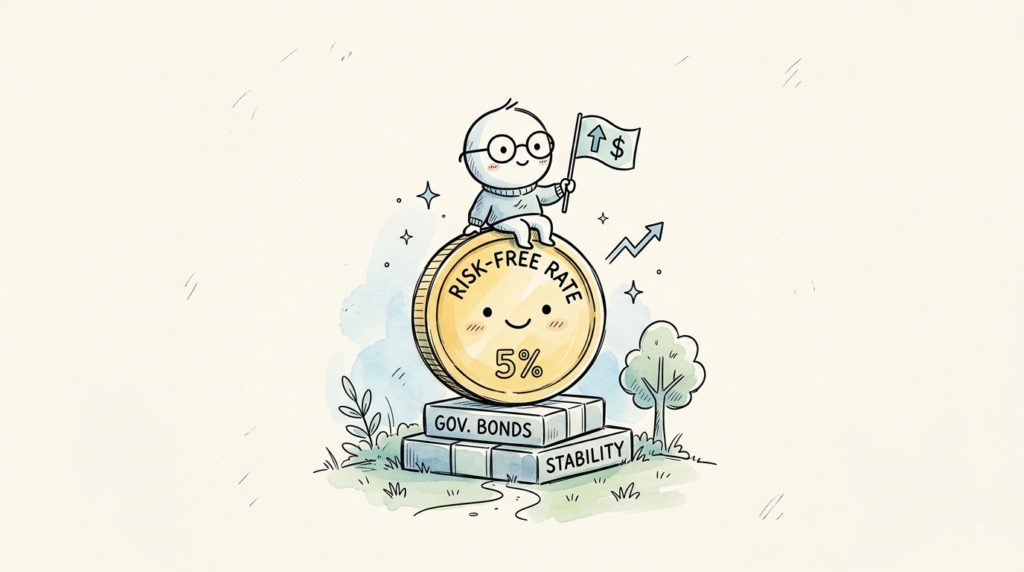
Before asking “How much can this stock make?”, we must establish an emotionless baseline: the Risk-Free Rate.
In financial markets, the Risk-Free Rate is typically represented by short-term US Treasury yields or government-guaranteed bank fixed deposits (e.g., 3% to 4%).
Its core logical meaning is straightforward:
“If I take zero risk of capital loss, check no daily stock charts, and bear zero mental strain, this is the guaranteed baseline return I receive by simply holding this asset.”
This is the floor for all investment decisions.
When your money sits in CDs or US Treasuries, your mind is at peace. Even if the outside world is in turmoil, your principal will not drop by a third overnight. That peace of mind is the greatest intrinsic value of a risk-free asset.
Equity Risk Premium: Every Extra Dollar You Earn is Compensation for Emotional Pain
If risk-free assets are so safe, why do we invest in stocks?
Because we want higher returns—say, 8% or 10%. But why would the market hand you an extra 4% to 6% for free?
This brings us to a fundamental concept: the Equity Risk Premium (ERP).
Expected Equity Return =Risk-Free Rate (e.g., 3%) + Equity Risk Premium (e.g., 5%) Exhaust
Always remember this principle: The extra 5% risk premium is not a free gift from the market; it is compensation paid to you for bearing uncertainty.
Behind this compensation lies an unwritten, invisible contract:
To enjoy this 5% excess return, you agree to endure the psychological torture of your portfolio crashing by $X% or more at some unpredictable point in the future.
Countless investors panicked during the 2020 crash because, when they bought in, they thought they were simply signing up for an idyllic 8% compound growth curve. They never realized that the 8% return came bundled with a psychological toll. When the bill came due, they couldn’t pay it, fled back to the safety of risk-free assets, and handed over their shares right at the bottom.
| Investment Tier | Expected Annual Return | Required “Risk Cost” | Mental Strain & Trade-Off |
| Risk-Free Assets (Treasuries / CDs) | 3% – 4% | 0% Principal Drawdown | Zero mental strain; sleep peacefully at night. |
| Financial Sweet Spot (Quality Stocks / Market Index) | 7% – 12% | 30% – 40% Cyclical Crash | Must endure paper losses without panic selling. |
| High-Risk Speculative Assets | 20%+ (Highly Unsustainable) | 80%+ or Total Wiping Risk | Extreme anxiety with constant risk of ruin. |
4. Practical Risk Premium & Mental Framework Assessment
Before making any investment, don’t just ask “How much can this stock make?” Instead, ask: “To earn this risk premium, how much volatility am I truly prepared to endure?”
Use this interactive framework tool to evaluate your portfolio’s risk-free baseline versus the equity risk premium:
5. Quantitative Perspective: Making the Risk Premium Predictable and Bearable
How do we build a portfolio we can actually hold onto when panic strikes?
In quantitative investing, we don’t try to predict whether the market will crash tomorrow—because no human can predict short-term swings.
The true value of a quantitative model is providing an anchor of rationality during market turmoil:
- Evaluate whether the Risk Premium is sufficient:If a stock exhibits extreme volatility but offers an expected return only 1% above the risk-free rate, it is a “Low Risk Premium Trap” and not worth taking the risk.
- Anchor the floor with cash flow:When the market drops 30%, if your portfolio of high-quality dividend stocks delivers a 7% cash yield (far exceeding a 3% risk-free rate) with strong fundamental health scores, that objective data gives you conviction. It reminds you that your risk compensation remains intact, keeping you from panic selling at the bottom.
Conclusion: Understanding Fear and Greed is the True Starting Point of Long-Term Compounding
Perfect compounding formulas exist only inside Excel spreadsheets. Real-world investing, however, takes place inside a human mind driven by fear and greed.
Compounding is the product of time, but the risk premium is the reward for overcoming fear.
Acknowledge the existence of the risk-free rate and clarify the emotional price you are willing to pay. Once you find a sweet spot between acceptable returns and peace of mind during a crash, you can stay in the game and let time become your most powerful ally.
Part 1:How to Calculate Dividend Yield? Don’t Get Fooled by High Yields!
Part 2:Dividend Yield vs. Bank Deposit: What’s the Real Difference?
Part 4:What Is TTM Dividend Yield? The Historical Data Trap Most Dividend Investors Fall Into
Part 6:What is the Dividend Yield Percentile? A Must-Know Valuation Metric for Dividend Investors
Part 8:What Is Annualized Return? Plus Free Annualized Return Calculator
Part 9:Savings vs. Investing: Don’t Let “Paper Safety” Steal Your Future
Part 10:The Rule of 72: Calculate Your Money Doubling Time in 5 Seconds!