When checking the stock market, dividend investors often do one common thing: open a financial tracking website, look at the dividend yield rankings, and assume that the higher the number, the better the bargain. However, there is a catch with this approach—the exact same yield percentage has completely different meanings for different stocks. A 4% yield for a stable utility company like Duke Energy might be considered on the low side, whereas a 4% yield for a cyclical stock might already represent a relative peak. Simply comparing absolute numbers on a ranking list cannot genuinely tell you whether a stock is “expensive” or “cheap”.
This is why the concept of the “Dividend Yield Percentile” exists: instead of comparing absolute yield figures, it compares a stock’s current dividend yield against its own historical record, translating it into a ranking position from 0% to 100%.
This article breaks down the concept, calculation method, and usage limitations of the dividend yield percentile to give you a more solid foundation for your dividend investing decisions.
Table of Contents
I. Understanding “Dividend Yield” First
Before discussing percentiles, let’s review the definition of dividend yield:

For example, if a stock is priced at $100 and has paid $5 in cash dividends over the past year, its dividend yield is 5%.
The formula reveals a crucial principle: the lower the stock price, the higher the yield; the higher the stock price, the lower the yield (assuming dividends remain constant). This is why many dividend investors use yield to evaluate whether a current purchase price is expensive or cheap.
However, stock yields do not have a universal “high” or “low” standard. If you apply the logic of bond yields or fixed-deposit rates directly to stocks, you easily fall into the so-called “high-yield trap.”
The reason is that the principal of investment-grade bonds (excluding junk bonds) or bank deposits remains relatively stable, whereas stock prices can fluctuate wildly, creating completely different risk structures.
Peer comparisons can also be misleading. For example, Coca-Cola’s dividend yield is roughly $3.1%, while PepsiCo’s is around 3.0%. Looking at the numbers alone, can you conclude that one is inherently a better investment than the other based solely on yield?
Not really—every stock has its own natural dividend yield range. Cross-company comparisons tend to distort reality; what you should truly reference is an individual stock’s proprietary historical dividend data.
A subsequent question arises: Is every stock’s historical dividend data worth referencing? Not necessarily.
Simply put, if a company has stable dividend payouts and minimal yield volatility, its historical yield holds strong reference value, and tracking its yield trajectory is meaningful. Conversely, if dividend policies change frequently and yields swing unpredictably, looking at historical numbers for guidance is no different from buying blindly.
II. What is the Dividend Yield Percentile?
Once you confirm that a stock’s dividend yield is reliable, the next step is to use the percentile tool to convert the yield into a more intuitive figure.
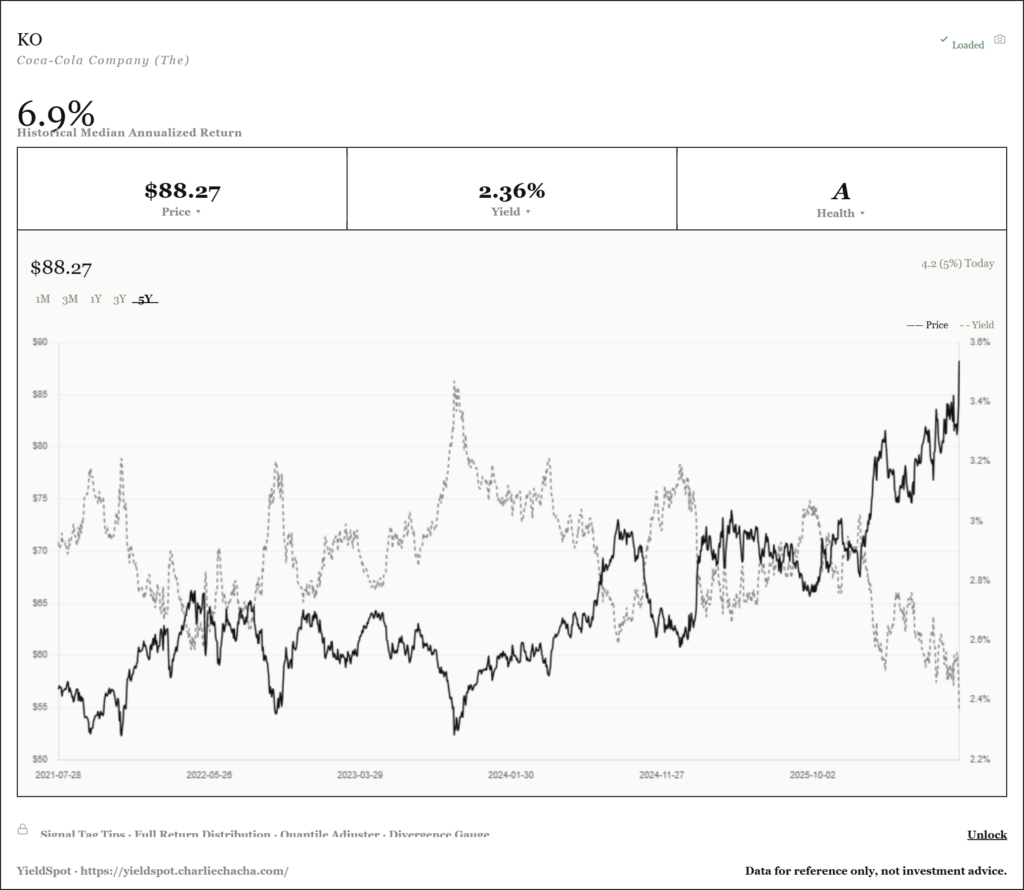
The dividend yield percentile places a stock’s current dividend yield into its historical data over a past timeframe (such as 5 or 10 years) to see where the current figure ranks on a percentage scale.
Explained in plain terms:
- Rank the daily (or weekly) dividend yields over the past 5 years from lowest to highest.
- Check what percentage of past data “today’s dividend yield” outperforms.
- This ranking percentage is the dividend yield percentile.
For instance, if a stock has a “current dividend yield percentile of 20%,” it means: the current yield outperforms only 20% of the trading days over the past 5 years. In other words, 80% of the time over the past 5 years, the yield was higher than it is now—implying that the current stock price is relatively “expensive” compared to the past (because a low yield represents a high stock price).
Conversely, if the percentile is 80%, it means the current yield outperforms 80% of past observations, indicating that the yield is currently near a historical relative high, which implies the stock price may be relatively cheap.
III. Summary of Simple Formulas
| Dividend Yield Percentile | Underlying Meaning | General Interpretation |
| Low Percentile (e.g., 0%–20%) | Current yield is near a recent relative low | Stock price is relatively expensive |
| Medium Percentile (e.g., 40%–60%) | Yield falls near the historical median | Stock price sits in a fair value range |
| High Percentile (e.g., 80%–100%) | Current yield is near a recent relative high | Stock price is relatively cheap |
Many dividend investors set simple rules such as, “Do not buy if the dividend yield percentile is below 20%, and only accumulate shares when it exceeds 80%” in hopes of avoiding buying high and selling low.
However, reality is far more complex than this rule suggests, and relying solely on this threshold can still trap investors in high-yield traps.
Taking stocks with stable dividends as an example, a low percentile usually indicates that the stock price is favored by the market, and its subsequent one-year returns may not necessarily underperform those of high-percentile scenarios. Meanwhile, a high percentile with a depressed stock price could stem from deteriorating business performance or other negative news, causing the stock price to remain under pressure and struggle to bounce back.
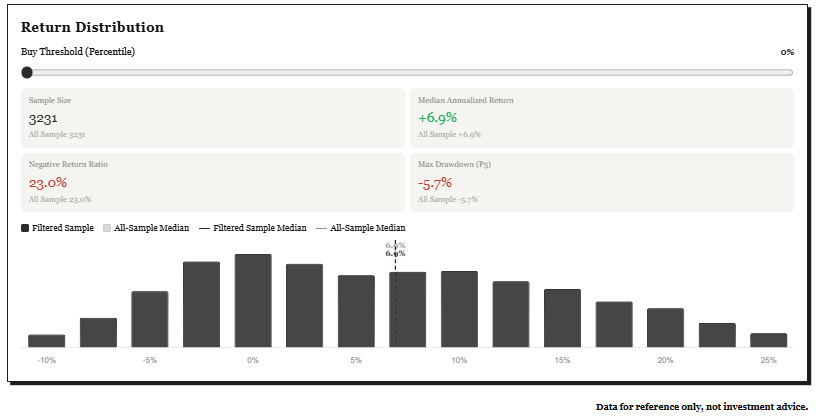
This means the percentile itself does not automatically equate to “cheap” or “expensive”; one must further examine the historical correlation between the “percentile” and “future returns.”
If a stock historically demonstrates the pattern that “the higher the percentile, the better the subsequent returns,” then entering positions at a high percentile holds substantive meaning. If no such pattern exists, operating purely on percentiles can backfire.
Investing has never had a single simple formula to blindly copy. What we can do is incorporate as many relevant conditions as possible into our judgment to slightly improve the probability of generating excess returns.
IV. Practical Ways to Check Dividend Yield Percentiles
To check dividend yield percentiles, you do not need to calculate them yourself; ready-made tools are already available in the market:
- TradingView: Developers have created “Dividend Percentile Rank” indicator scripts that can be overlaid directly onto stock charts to review historical percentile ranges.
- Yieldspot: A dedicated platform providing dividend yield percentiles, Median Annualized Return, Max drawdown.
Conclusion
The dividend yield percentile is a relative valuation tool that helps dividend investors determine whether a current purchase offers a worthwhile yield. Its core concept is comparing the current dividend yield against the stock’s own historical data ranking.
Remember, however, that the percentile is merely an auxiliary tool and should not serve as the sole basis for trading decisions.
Finally, let’s briefly touch upon the differences between long-term and short-term investing. Aside from testing stock selection and entry/exit timing, short-term investing heavily relies on one’s ability to control emotional responses when facing stock price volatility.
Long-term investing is comparatively less affected by “timing”—as the investment horizon lengthens, return volatility tends to converge.
If controlling market movements, corporate shifts, or emotional variables is too difficult, what we can control at minimum is our own investment horizon. By mentally preparing ahead for “reasonable returns” and “maximum drawdown,” paired with a disciplined, systematic execution approach, you can drastically boost your chances of capturing positive long-term returns.
Disclaimer: This article is for financial knowledge sharing only and does not constitute any investment advice. Please evaluate risks independently or consult a professional financial advisor before investing.
Part 1:How to Calculate Dividend Yield? Don’t Get Fooled by High Yields!
Part 2:Dividend Yield vs. Bank Deposit: What’s the Real Difference?
Part 4:What Is TTM Dividend Yield? The Historical Data Trap Most Dividend Investors Fall Into
Part 6:What is the Dividend Yield Percentile? A Must-Know Valuation Metric for Dividend Investors
Part 8:What Is Annualized Return? Plus Free Annualized Return Calculator