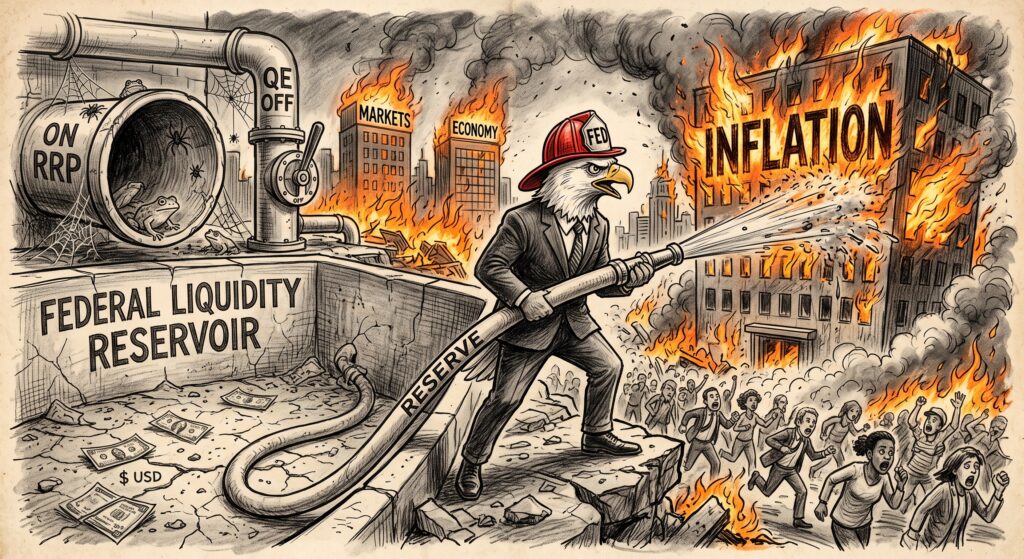
To materialize abstract macro concepts, we have developed the Reserve Pulse Analyzer. For ease of use, it is positioned at the top of this page, with the theoretical mechanics explained below. It filters out all unnecessary noise, integrating real-time data from the Federal Reserve and the U.S. Treasury. You can manually adjust the slider below to simulate: if the U.S. government accelerates debt issuance to absorb liquidity, how many months remain for this financial lifeline before it crashes into the $2.5 trillion critical warning line?
Every day, countless investors monitor CPI data and non-farm payrolls, attempting to decipher the probability of the next rate hike or cut from the fleeting words of Fed officials. However, when reviewing the market frenzies and flash crashes of recent years, a brutal reality emerges:
The rise and fall of asset prices are fundamentally never driven by the absolute level of “interest rates,” but rather by the underlying “Federal Reserve liquidity level” within the financial plumbing.
The past two years serve as the perfect testament. The Fed initiated a continuous rate-cutting cycle starting in September 2024, only raising rates for the first time by 0.25% in September 2026. Yet, long-term bond yields surged unabated after touching 3.95%. While financial news frequently broadcasted panic that “breaking long-term yield thresholds will trigger a crisis,” we witnessed the S&P 500 completely ignoring this noise, repeatedly hitting all-time highs.
These phenomena repeatedly validate one core truth: as long as the pipes irrigating the market remain flush with cash (abundant liquidity), no interest rate is high enough to suppress market euphoria; conversely, once the reservoir runs dry (liquidity depletion), even the slightest negative catalyst can trigger an epic stampede. Here, we shatter the myths of traditional macro analysis and guide you in building a liquidity observation framework based entirely on “calculating levels, ignoring sentiment.”
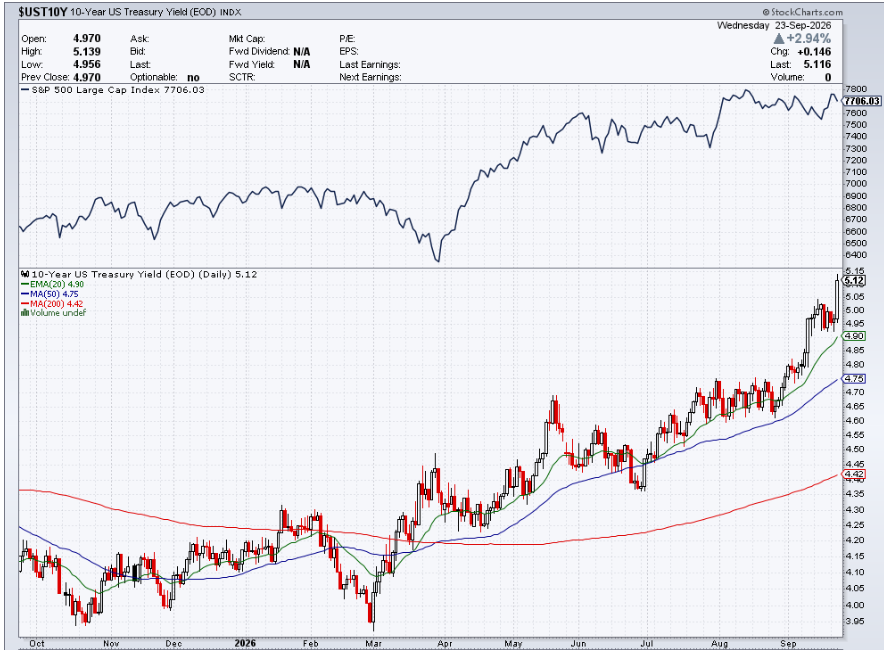
Table of Contents
Debunking the Myth: The Drainer Has Changed, and Wall Street’s “Engine Oil” is Being Ruthlessly Extracted
Anyone marginally following financial news has likely heard: “The Fed has halted Quantitative Tightening (QT).” Consequently, many investors breathed a sigh of relief, assuming the market’s liquidity crisis was resolved simply because the Fed stopped actively withdrawing funds.
This is a fatal miscalculation.
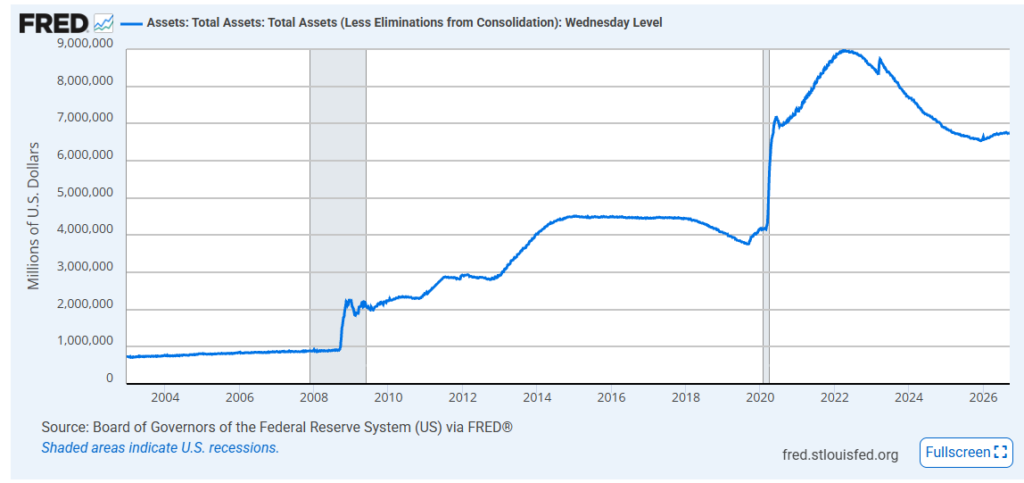
While the Fed’s water pump has indeed been shut off, another, much larger “super vacuum”—the U.S. Treasury—is operating at maximum capacity. To cover a massive fiscal deficit, the U.S. government must furiously issue an ocean of Treasuries to borrow money from the public. Many possess a blind spot here, thinking, “Using money in my account to buy Treasuries just converts my deposits into bonds; what does this have to do with the broader market?”
Viewed from the lowest tier of the financial system, the true flow of capital is brutally unforgiving: When hedge funds or retail investors purchase Treasuries, their backing commercial banks must remit funds from their own “Reserves” at the Fed into the government’s exclusive piggy bank (the TGA account).
This means every Treasury issuance directly drains reserves from commercial banks. Wall Street banks require sufficient reserves to lend to one another, maintain settlements, and even provide capital to market makers for equity trading.
You might ask: “If the government has been wildly issuing debt to drain liquidity over the past two years, why hasn’t the market collapsed already?”
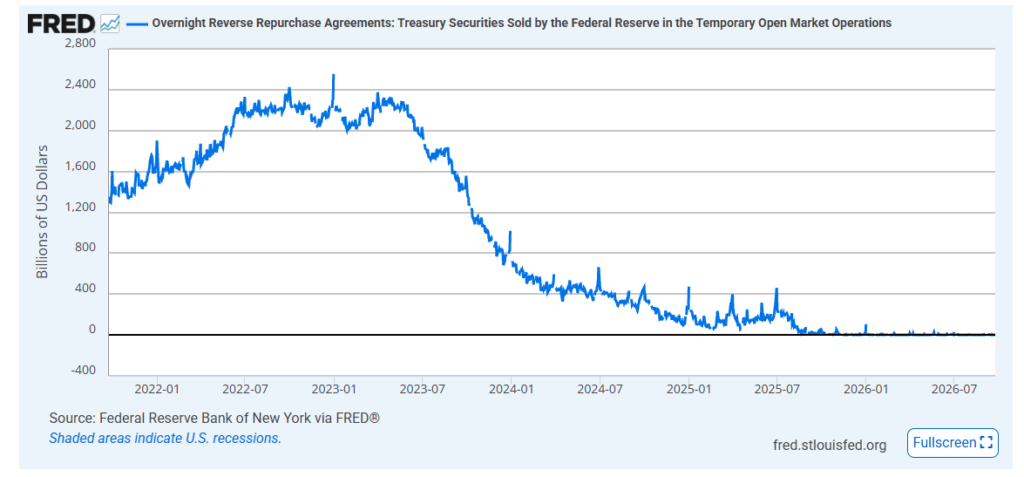
This is because a colossal “backup reservoir” known as the Overnight Reverse Repurchase Facility (ON RRP) existed. Previously, when the government issued debt, the market utilized the idle cash parked in this buffer, sparing the foundational commercial banking system. Because this sponge absorbed the impact, the stock market could continue its revelry.
But the chilling truth is: this backup reservoir was virtually depleted by mid-2025.
This signifies that the market’s “defensive shield” has been offline for over a year. Since mid-2025, for every new dollar of national debt issued, this super vacuum has been directly and ruthlessly tapping into the market’s final lifeline—”Commercial Bank Reserves”—steadily siphoning off reserves month after month.
This is precisely why we disregard broad money supply or retail deposits; we lock our focus dead-set on the reserve level. Once reserves breach the $2.5 trillion lowest comfortable yellow line, the Wall Street money-printing sports car will likely suffer a blown engine and instantly stall, detonating a market-wide stampede crisis.
Who Prices the Long End? The Fed’s “Short Arm” vs. The Market’s “Long Whip”
Many investors operate under the misconception that Fed rate hikes or cuts can perfectly control all interest rates. In reality, the Fed’s reach is short; it can only precisely dictate “overnight” short-term benchmark rates. (For deeper insights into Fed rate hike mechanics like the Federal Funds Rate, IOER, and ON RRP, refer to prior fundamental materials).
The true arbiters of the real economy, corporate bond issuance, and equity market survival are the 10-year and 30-year long-term bond yields. The pricing power of the long end is firmly gripped by “market supply and demand.”
When liquidity is abundant, the market willingly follows the Fed’s “Forward Guidance.” However, when underlying liquidity dries up, the physical laws of supply and demand will utterly crush the Fed’s verbal interventions. Once the bid disappears, long-term yields will surge like runaway horses—this is what we call “the market seizing pricing power.”
The True Catalyst Behind Surging Yields: The Domino Effect of Vanishing Buyers
Prior to the Fed’s renewed rate hike in September 2026, the central bank had been cutting rates, yet long-term Treasury yields uncontrollably spiked. The answer again lies in the liquidity level.
The astronomical volume of new debt issued monthly by the Treasury must be digested by Wall Street market makers, banks, and hedge funds using cash on hand.
- When Levels are Abundant: The market effortlessly absorbs these bonds, and yields remain stable.
- When Levels are Depleted: Bank reserves approach critical thresholds, leaving financial institutions with less cash to buy bonds.
At this juncture, a stark reality materializes: Massive Treasury Supply > Depleted Liquidity Demand. To clear the bond inventory, the market is forced to demand a higher “risk premium.” Bond prices plummet, and yields violently spike. This yield surge, triggered by “liquidity starvation,” is exceedingly lethal and will ultimately serve as the final straw that breaks the equity market’s back.
Why Treasury “Buybacks” Cannot Rescue Surging Yields
Recently (August and September 2026), U.S. Treasury Secretary Scott Bessent announced a doubling of the “Buyback” program for 10- to 30-year long bonds, increasing the scale from $2 billion to $4 billion per operation, and even raising the cap to $6 billion during the September auctions.
This move sparked massive controversy and misunderstanding. Many assumed the Treasury was stepping in to “bail out” the market, attempting to suppress soaring long-term yields (Wall Street even jokingly dubbed this the “Bessent Put” or “soft yield curve control”).
But facts prove this intervention was entirely futile.
Although 30-year and 10-year yields briefly dipped on the day of the announcement, the market quickly sobered up. Long-term yields continued their runaway surge, with the 10-year Treasury yield even shattering the psychological 5% barrier in September, hitting highs not seen since 2007. Why does the Treasury directly buying bonds fail to suppress yields? We must return to our “liquidity and zero-sum game” framework:
- The Goal is “Liquidity Support,” Not “Quantitative Easing (QE)” The official Treasury stance is that expanding buybacks provides “Liquidity Support.” They are purchasing seasoned, highly illiquid “off-the-run” bonds. This acts like clearing inventory for Wall Street market makers, freeing up their balance sheets to buy future newly issued Treasuries. This is a micro-operation to “unclog the plumbing,” not a macroeconomic maneuver where the Fed prints money out of thin air to aggressively sweep the market (QE) to lower rates.
- A Drop in the Bucket: $6 Billion Cannot Stop a $40 Trillion Debt Behemoth Compared to a staggering $40 trillion total U.S. debt and over $100 billion in monthly issuance, a mere $6 billion buyback is a drop in the bucket. The market currently faces immense “structural selling pressure”: out-of-control U.S. fiscal deficits, massive corporate debt issuance driven by AI infrastructure competition, and stubbornly high inflation expectations. When the “long bond supply” vastly exceeds “capital demand,” a $6 billion bid fundamentally cannot reverse macroeconomic supply-demand imbalances.
- The “Zero-Sum Game” of Moving Money from the Left Pocket to the Right The most fatal flaw is: where does the Treasury get the money to buy these long bonds? The Treasury lacks the power to print money. To raise the $6 billion for long-bond buybacks, it must simultaneously issue $6 billion in short-term T-bills into the market or drain cash from its own TGA account. This means the aggregate national debt does not decrease by a single cent; the Treasury is merely swapping long debt for short debt (akin to the Fed’s historical Operation Twist). Without adding water to the foundational reservoir (Reserves), this left-pocket-to-right-pocket illusion cannot fool the market.
This once again solidifies our core thesis: When the Fed is no longer printing money (stopping total reservoir injections) while the Treasury continues furiously issuing debt to drain liquidity, no micro-financial maneuvers can defy physical laws. The pricing power of long-term yields has been completely hijacked by market supply and demand, and will remain so until the real economy collapses, forcing the Fed to restart the printing presses.
Tactical Observation Framework: Identifying the Liquidity “Friction Tipping Point”
To predict when the market will break, we must laser-focus on one core metric: Total Reserves of Depository Institutions at the Fed (Ticker: TOTRESNS / WRESBAL). Based on Wall Street’s Lowest Comfortable Level of Reserves (LCLoR) estimates and historical precedent, we divide reserve levels into three highly actionable tactical zones:
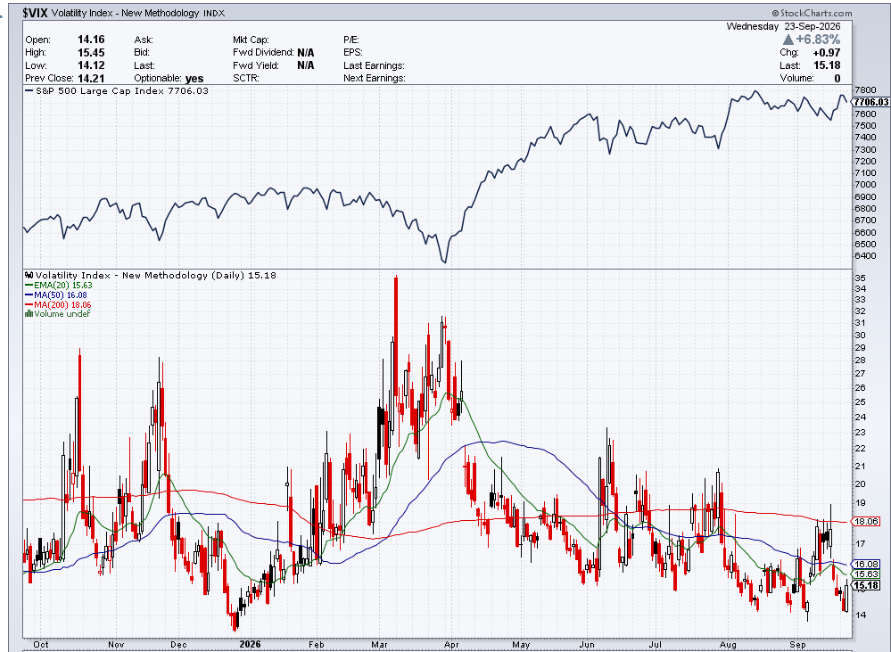
- 🟢 Safe & Abundant Zone (> $2.5 Trillion): Sufficient liquidity. Market capital is loose, and the VIX volatility index is typically suppressed below 15. During this phase, any pullback is a buying opportunity.
- 🟡 Friction & Alert Zone ($2.0 Trillion ~ $2.5 Trillion): The turning point arrives. Banks begin hoarding cash to meet regulatory requirements, causing occasional spikes in borrowing costs. The stock market will experience “inexplicable plunges without major negative news catalysts,” and the VIX baseline elevates to 20-25. This is a definitive signal for defensive derisking.
- 🔴 Liquidity Depletion Zone (< $2.0 Trillion): Crisis eruption. A repeat of the September 2019 repo market disaster. Institutions indiscriminately dump assets for cash, triggering a dual collapse in both stocks and bonds. The only viable move here is clinging to cash and waiting for the Fed to be forced into a market bailout pivot.
Conclusion: Read the Water Meter Before the Tide Goes Out
The most dangerous element in financial markets isn’t the universally known bearish news, but the unnoticed structural fractures beneath the surface.
By tracking Fed liquidity and reserve levels, we don’t need to guess which stock will rally tomorrow, nor do we need to obsess over whether next month’s inflation is 2.1% or 2.2%. We do only one thing: verify the thickness of the ice beneath our feet.
When the indicators show we are still in the safe zone above $2.5 trillion, the market trend is highly likely to persist. However, as the countdown closes in and levels plunge into the alert zone, remember to pack away your greed one step ahead of the crowd. Because once a liquidity crisis hits, no one is spared.
(Note: This tool is fully automated. If you find it valuable, please leave a comment below to let me know, and I will continue developing more tools to observe market shifts.)