Yield Percentile Analysis
You notice a stock’s dividend yield surging and feel it might be an opportunity—but you don’t know if this “high” is genuinely high historically.
Yieldspot turns intuition into quantitative data.
It compiles 14 years of dividend yield history to show exactly where the current level stands historically and what happened under similar past conditions.
Free Trial License Key valid through 2026/08/31
What is Yieldspot?
Yieldspot is a financial quantitative historical analysis tool built for long-term dividend and value investors. The platform processes global market historical data, calculates 14-year Yield Percentiles, historical median annual returns, and dynamic Withholding Tax (WHT) adjustments, translating complex statistics into clean, actionable visual insights.
Yieldspot does not offer price predictions, stock recommendations, or financial advice. It provides purely objective historical data analysis to support independent investment research.
Yieldspot does not offer price predictions, stock recommendations, or financial advice. It provides purely objective historical data analysis to support independent investment research.
What Is a Dividend Yield Percentile?
When a stock’s dividend yield rises, it’s tempting to assume “this looks cheap now.” But whether that yield is actually high means nothing without historical context — without it, you’re just going on a feeling, not a judgment.
A yield percentile turns that feeling into a precise historical coordinate. The definition is simple: what share of the past years did the current yield outrank?
A yield percentile turns that feeling into a precise historical coordinate. The definition is simple: what share of the past years did the current yield outrank?
Don’t Get the Direction Backwards
A yield percentile of 10% means the yield was higher than today’s 90% of the time historically — so the current yield is actually on the low end, and the stock is relatively expensive versus its dividend.
A yield percentile of 90% means the yield was lower than today’s 90% of the time — so the current yield is on the high end, and the stock is relatively cheap versus its dividend.
Higher percentile generally means the price is cheap relative to its own history; lower percentile means relatively expensive. This trips people up because yield is an inverse metric: price up, yield down; price down, yield up.
A yield percentile of 90% means the yield was lower than today’s 90% of the time — so the current yield is on the high end, and the stock is relatively cheap versus its dividend.
Higher percentile generally means the price is cheap relative to its own history; lower percentile means relatively expensive. This trips people up because yield is an inverse metric: price up, yield down; price down, yield up.
But a percentile only flags an outlier — it doesn’t tell you whether that outlier is justified, and it’s never a standalone buy signal. The same high percentile can hide very different stories:
High Percentile + Stable Fundamentals
The price may have simply been oversold on systemic headwinds, passively pushing yield up — a candidate for mean reversion.
High Percentile + Deteriorating Fundamentals
Earnings are declining and the payout may be cut ahead — the price hasn’t fully priced in the risk yet, an easy value trap to misread as “cheap.”
Low Percentile + Strong Growth
The market is pricing in a growth premium — a low yield doesn’t mean overpriced, it reflects expected future earnings and dividend growth.
Low Percentile + Ordinary Fundamentals
Without a clear growth story, a price pushed to historic highs is worth watching — it may have drifted too far from fundamentals.
This is exactly why Yieldspot pairs percentiles with the Health Rating and short/long-term divergence signals — percentiles surface the historical extremes, fundamentals answer whether that extreme is justified. Together they form a more complete basis for judgment, rather than a conclusion drawn from a single number.
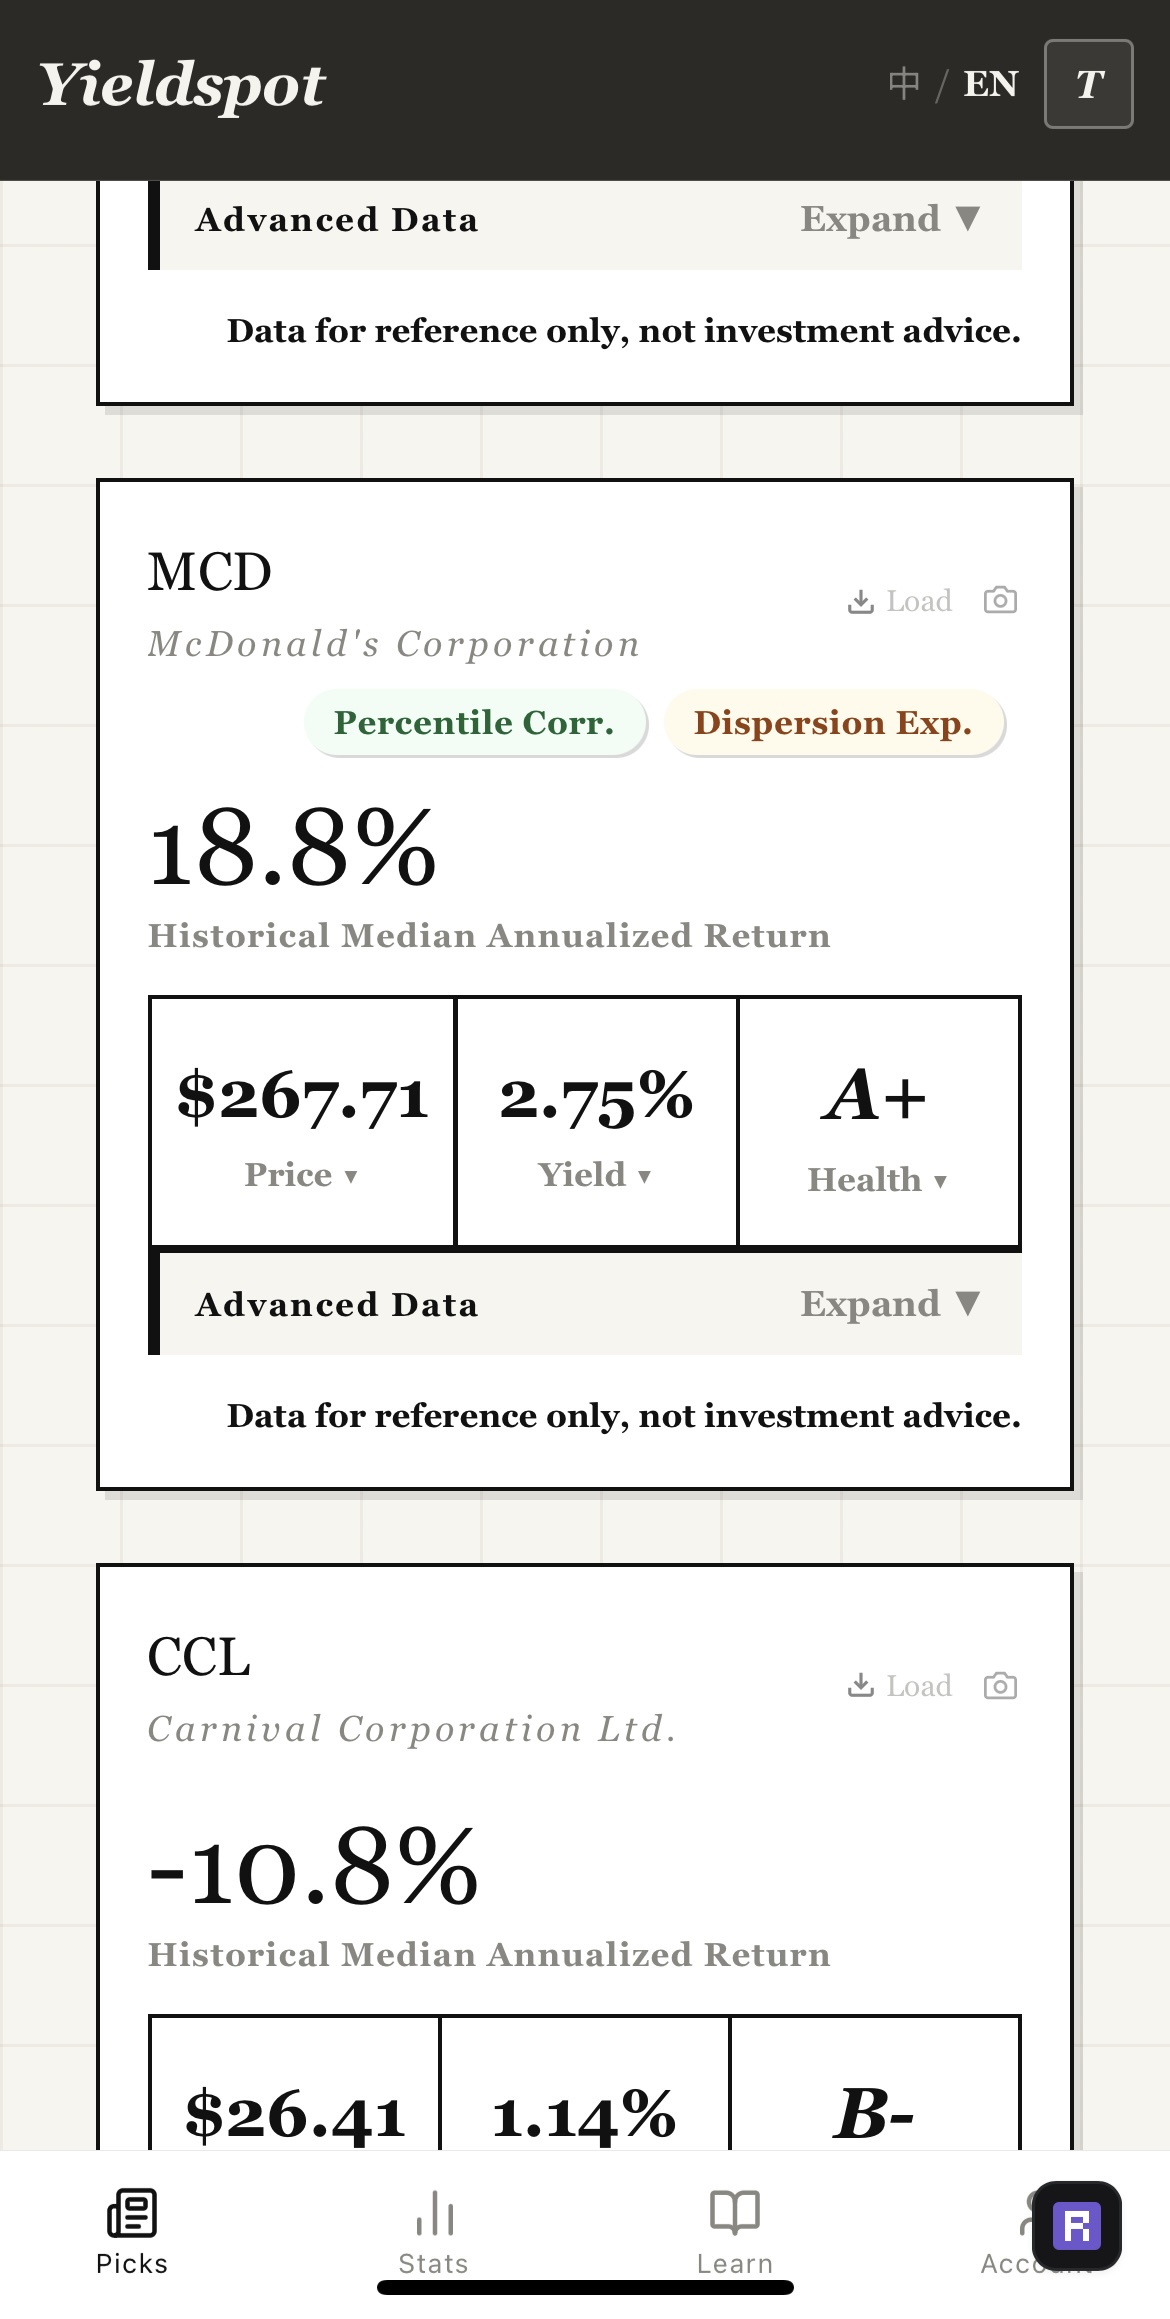
Yieldspot Interface Preview
Frequently Asked Questions
Q1: What does “Percentile” mean? Why use percentiles instead of current yield alone?
Yieldspot uses percentiles to quantify where the current yield stands relative to history. An 80th percentile means current yield is higher than 80% of historical observations over the past 14 years. A standalone yield figure (e.g., 6%) lacks historical context, whereas percentiles place data within a clear historical framework.
Q2: Will one-off special dividends or asset sales distort the yield percentile?
No. Yieldspot eliminates these distortions through automated data cleaning models. Traditional yield metrics often spike due to non-recurring special dividends, creating artificial high-yield traps. Yieldspot identifies and filters out one-off special payouts from baseline yield and growth calculations, while fully accounting for them in Total Return metrics.
Q3: How does Yieldspot address Value Traps?
When business fundamentals deteriorate and stock prices drop persistently, high yield percentiles may signal a value trap. To mitigate this, Yieldspot cross-references short-term and long-term yield percentiles to detect structural trends versus temporary dislocations.
Q4: What do tags like Percentile Correlation or Divergence Expansion signify?
These are long-cycle validation tags that confirm whether historical yield percentiles carry statistical significance. Overlay signals like Positive or Negative Divergence trigger only when short-term and long-term percentiles diverge by more than 30%.
Q5: What does the Health Rating represent?
It is a reference rating based on fundamental stability. Companies with higher ratings have historically maintained more reliable operating performance over extended cycles.
Q6: What is the difference between the Free and Pro plans?
The Basic plan helps you identify signals, while the Pro plan unlocks full historical evidence to refine your quantitative research:
Basic Plan Free Forever ($0)
- ✓ Historical Median Annual Return
- ✓ Price & Yield Charts
- ✓ Normal Distribution Chart
- ✓ Health Rating
Pro Plan $9.99$6.99 / mo
- ✦ Signal Tag Alerts
- ✦ Full Return Distribution Ranges
- ✦ Custom Percentile Adjuster
- ✦ Divergence Gauge Dashboard